Adding MCP servers one at a time means client configuration grows with the server count, and who may call which tool ends up being managed per server. That leads you to consider putting a gateway in front, and there are two of those under the Agentic AI Foundation (AAIF). One is agentgateway; the other took the name Agent Router on 2026-09-10.
That second one used to be called Envoy AI Gateway, and its repository lived at
envoyproxy/ai-gateway. Sitting under the Envoy project, it followed CNCF governance
at the time, and the README as late as v1.1.0 in August 2026 still says it adheres to
the CNCF Code of Conduct. It then went through AAIF’s project proposal process, with
board approval landing on 2026-08-18. The rename was announced on 09-09 and the new
name has been in use since the 10th, so this was not just a rename: the foundation
changed first and the name followed. The repository moved to
theagentrouter/agent-router.
I had already measured the first one, and one thing came out of it. Authorization that takes the arguments of a tool call as its condition did not work on the authorization path when written into the MCP authorization policy, and calls that met the condition were blocked along with the rest. I filed that upstream, and there is now a separate route-level policy where such a condition does work. Agent Router, though, says in its documentation that a CEL expression in an authorization rule can use call arguments, and ships an example. So this time I set out to check whether that sentence holds.
To put the result first: argument-condition authorization does work. The same tool
called by the same name passes with one argument value and is blocked with another.
It costs about 20ms per response, and the default deployment topped out at around 100
requests per second. Writing the argument condition the way the documentation shows
leaves tools/list returning nothing at all, so an agent finds no tools, though a small
change to the CEL expression avoids that.
I measured on a Kubernetes 1.37.0 cluster with Agent Router v1.1.0 over Envoy Gateway v1.8.1. The backends were an MCP server with 8 tools and one that reflects back whatever it receives. Swapping the policy and sending the same calls, I repeated each condition 75 times from 2026-09-14 to 09-16. All 21 conditions gave the same verdict in every cycle, with no measurement errors and no pod restarts.
- MCP (Model Context Protocol): the protocol through which a model uses external tools and data.
- MCP gateway: the component placed between an agent and MCP servers, presenting several servers as one and controlling calls.
- CEL (Common Expression Language): the expression language Kubernetes uses in several places to write conditions. Authorization rule conditions are written in it.
MCPRoute: the custom resource Agent Router provides to hold MCP configuration. Which backends to group and who may call what are written here.
Here is what the measurements turned up, on one page.
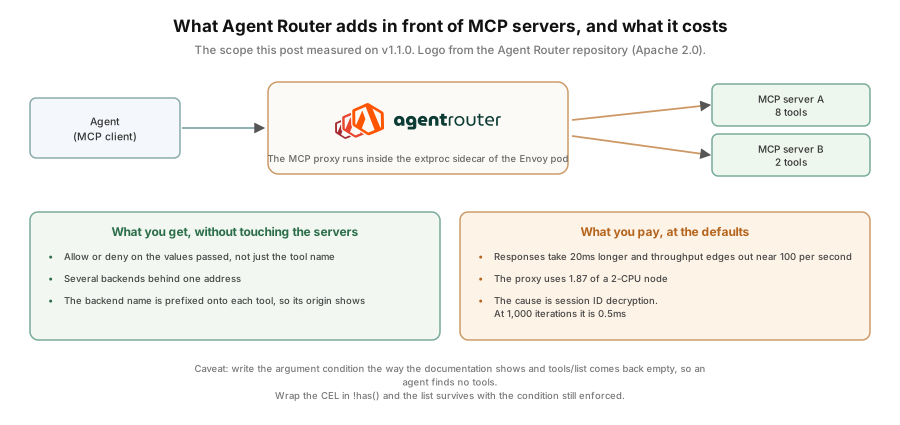
The rest of this post takes those items one at a time with the evidence behind them. One point about how Agent Router works makes the results easier to read first.
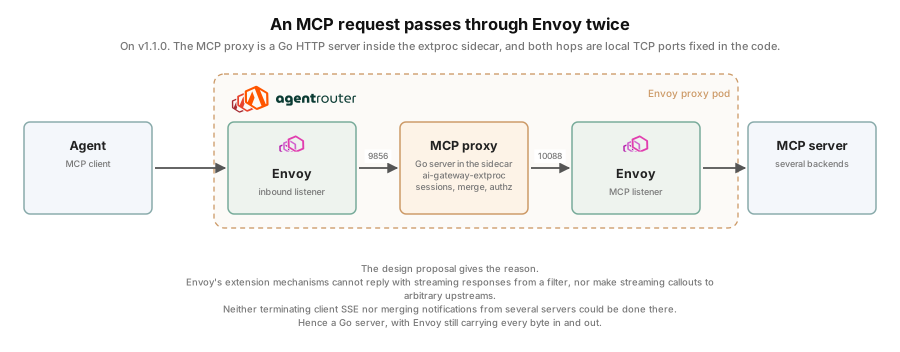
The MCP proxy runs as a Go server in a sidecar inside the Envoy proxy pod, so no separate pod is created for it. The design proposal gives the reason: Envoy’s extension mechanisms cannot reply with streaming responses from a filter, nor make streaming callouts to arbitrary upstreams, so terminating client SSE and merging notifications from several servers could not be done in a filter. Hence a Go server, with Envoy still carrying traffic in and out.
So an MCP request passes through Envoy twice. It arrives at the ingress listener and goes to the proxy on local port 9856, then the proxy sends it back to local port 10088 and it enters the MCP listener. Both legs are local TCP ports inside the same pod. Keep that shape in mind while reading the latency and throughput figures below.
The values passed on a call decide pass or block
Let me start with one authorization rule. It allows a tool called get-sum, but only
when the value a passed on the call is 1, written as a CEL condition. Values passed to
a tool like this are its arguments, and that is what the word means below.
securityPolicy:
  authorization:
    rules:
      - action: Allow
        target:
          tools:
            - backend: mcpb
              tool: get-sum
        cel: 'request.mcp.params.arguments.a == 1'
With that in place, calling the same tool twice with different arguments gives different results.
| Call | Result |
|---|---|
tools/call mcpb__get-sum a=1 | 200, result 3.0 |
tools/call mcpb__get-sum a=2 | 403 |
Repeating it 75 times changed nothing. It works as documented. Compared with a gateway that can only block by tool name, the unit of control moves down a level. agentgateway under the same foundation cannot do it in its MCP authorization policy and needs a route-level policy instead, a path that opened after the v1.5.0 this post measured.
There is one thing to watch here, though. The rule says get-sum while the call says
mcpb__get-sum. When Agent Router shows tool names to a client it renames them into
backend__tool form, but what the policy looks at is the original name before the
rename. Writing the name the client sees into the policy means no rule matches at all
and every call is blocked.
But nothing is left in the tool list
Leaving the same policy in place and calling tools/list returns no tools at all. It
does not stop at get-sum, the tool the rule names: all 8 tools that backend exposes
are gone.
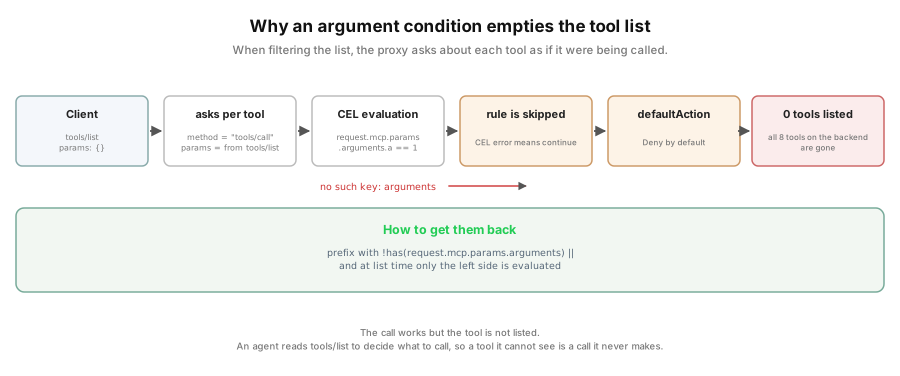
The proxy log spells out the reason.
level=ERROR msg="failed to evaluate authorization CEL" component=mcp-proxy
  error="no such key: arguments" expression="request.mcp.params.arguments.a == 1"
Following the source, what the proxy does while filtering the list is
unusual. It walks the tools one at a time and asks the authorization logic “would
calling this tool be allowed?”, putting tools/call in request.mcp.method and the
params of the tools/list request that just arrived into params. A list request’s
params have no arguments key, so a CEL expression referring to arguments is bound
to fail at evaluation.
What follows is the problem. The rule-evaluation loop in
internal/mcpproxy/authorization.go skips a rule and moves to the next one when CEL
evaluation ends in an error. With only one rule, the loop ends with nothing matched,
and what remains is defaultAction. Its default is Deny, so every tool drops out of
the list.
I confirmed that with three diagnostic rules. Writing the condition as
request.mcp.method == "tools/list" leaves 0 tools, and
request.mcp.method == "tools/call" leaves 1. The proxy asks as if the tool were
being called at the moment it filters the list.
What makes this awkward in operation is that the call itself is handled normally. An
agent reads tools/list to decide what to call, so a tool missing from the list is
one it will not try even when the call would pass. The moment argument-condition
authorization goes on the way the documentation shows, that endpoint looks to an agent
like a server with no tools.
I built four ways around it and measured them all. Only one worked intact.
| No. | Policy | List | a=1 | a=2 | Other tool |
|---|---|---|---|---|---|
| base | none | 8 | pass | pass | pass |
| base | as documented | 0 | pass | blocked | blocked |
| 1 | defaultAction to Allow, Allow rule kept | 8 | pass | pass | pass |
| 2 | defaultAction to Allow, condition inverted into a Deny rule | 8 | pass | blocked | pass |
| 3 | request.mcp.method != "tools/call" || ... | 0 | pass | blocked | blocked |
| 4 | !has(request.mcp.params.arguments) || ... | 1 | pass | blocked | blocked |
The first makes the default action Allow, so the argument condition stops blocking
anything. The second keeps the argument condition alive but opens every other tool not
named in a rule. The third looks right at a glance but does not work: because the proxy
asks with tools/call while filtering the list, the left side is false, the right side
is evaluated, and the same error comes out.
The fourth is the one that held. !has() is true when there are no arguments. At
list-filtering time there are none, so the left side is true and the expression stops
there. A real call carries arguments, the left side is false, and the right side is
evaluated. The allowed tool stays in the list and the argument condition is still
enforced.
cel: '!has(request.mcp.params.arguments) || request.mcp.params.arguments.a == 1'
A denial comes back as plain HTTP 403
I also recorded what shape a blocked call comes back in. It is HTTP 403 with a 13-byte
plain-text body, access denied.
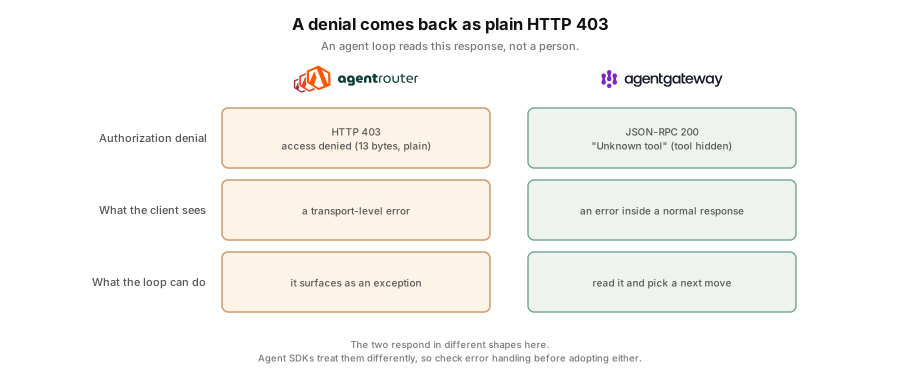
In the same situation agentgateway puts Unknown tool inside a JSON-RPC response so
the tool appears not to exist. The two gateways take different shapes in the same
situation, and it matters because what reads this response is an agent loop rather
than a person. A JSON-RPC error sits inside a normal response, so the loop can read it
and pick a next move, while HTTP 403 surfaces as a transport-level error and some SDKs
turn it into an exception. Rather than one being better, it is worth checking how the
agent SDK you use treats each before adopting.
There is also one place where a configuration slip closes the whole endpoint. Leaving
the rules of backendSelector empty means no backend can be chosen, so initialize
returns 403 and later calls get a 400 saying there is no session.
Passing through costs close to 20ms per response
I measured what a gateway in front costs. The path calling the backend directly and
the path through the gateway were measured the same way, and I added one more: an
HTTPRoute through the same Envoy on the same gateway that skips only the MCP proxy,
so the cost can be attributed to a leg.
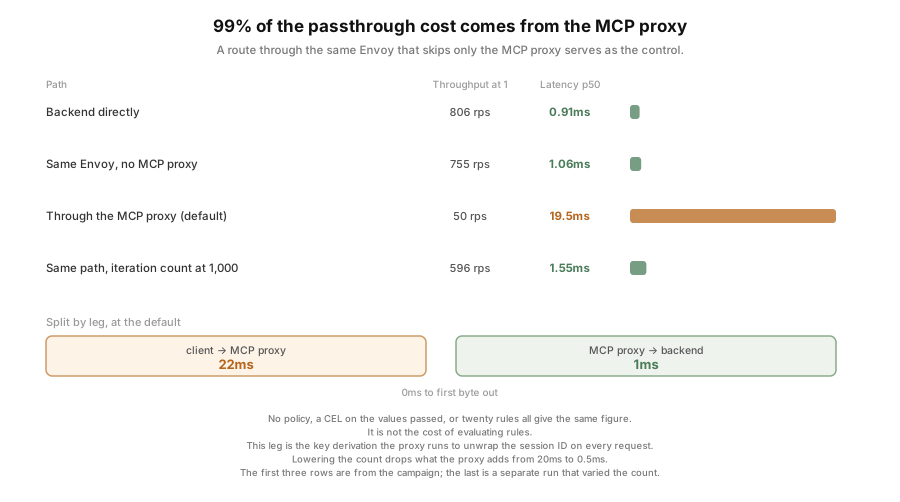
| Path | Concurrency 1 | Concurrency 16 |
|---|---|---|
| Backend directly | 806rps / 0.91ms | 675rps / 10.8ms |
| Same Envoy, no MCP proxy | 755rps / 1.06ms | 683rps / 10.8ms |
| Through the MCP proxy | 50rps / 19.5ms | 98rps / 159.6ms |
These come from the campaign, repeated 75 times. The 47rps and 21.0ms that appear below are the same condition in the single separate run I used to vary the iteration count.
Of the 18.6ms the gateway adds, passing through Envoy accounts for 0.15ms. The other 18.4ms is in the MCP proxy. At concurrency 16 the Envoy-only path and the direct path both sit at 10.8ms, with no difference I can resolve.
The cost also had nothing to do with how complex the policy was. No policy, an argument-condition CEL, and twenty rules all gave the same figure. So it is not the cost of evaluating rules.
The Envoy access log splits the legs more precisely. One request leaves two lines: the leg where the MCP proxy calls the backend has a p50 of 1ms, and the leg facing the client is 22ms.
Those 22ms go into unwrapping the session ID. The MCP proxy has to decrypt the session ID
that rides along with every request before it knows which backend to use, and it derives
that decryption key with PBKDF2 on every request without caching the result. The helm value
controller.mcp.sessionEncryption.iterations sets the count, and the default is 100,000.
So I lowered that one value to 1,000, left everything else alone, and ran the same load again.
| Measure | 100,000 iterations (default) | 1,000 iterations |
|---|---|---|
| Low-load p50 | 21.0ms | 1.55ms |
| Low-load throughput | 47 rps | 596 rps |
| Saturated throughput (concurrency 16) | 96 rps | 805 rps |
| Target of 100 rps | 97.2 achieved, 168 not sent | 100.0 achieved, 0 not sent |
| Proxy CPU under load | 1,874m | 329m |
The control sits at 1.06ms at the same concurrency, so what the proxy adds drops from 20ms to 0.5ms. It does not go to zero.
How you read the CPU matters here too. Sample kubectl top right after the load starts
and you get single-digit millicores, because the metrics-server aggregation window is 15
to 60 seconds and at that moment it is still looking at the idle period. Hold the load
for 180 seconds and sample every 15 seconds, and the readings climb through 1m, 237m,
913m, 1,848m before settling near 1,860m. That is 1.87 of the node’s 2 CPUs. The
Envoy container in the same pod sits at 30 to 44m under the same load.
The arithmetic checks out. At saturation it serves 96 requests per second on 1.87 cores, which works out to about 19.5ms of CPU per request, close to the 21.0ms response I measured at concurrency 1. The latency was CPU time.
Lowering it is not a free choice, because the value trades security for speed. Worth
noting, though: the same helm chart ships default-insecure-seed as the seed and its
comment tells you to replace it with a secure random string in production. A high
iteration count is what makes guessing a weak seed slow, so getting the seed right
matters more than tuning the count.
Adding replicas means looking at the traffic policy too
When throughput falls short, adding replicas is the first thing that comes to mind, and with the default settings it did nothing.
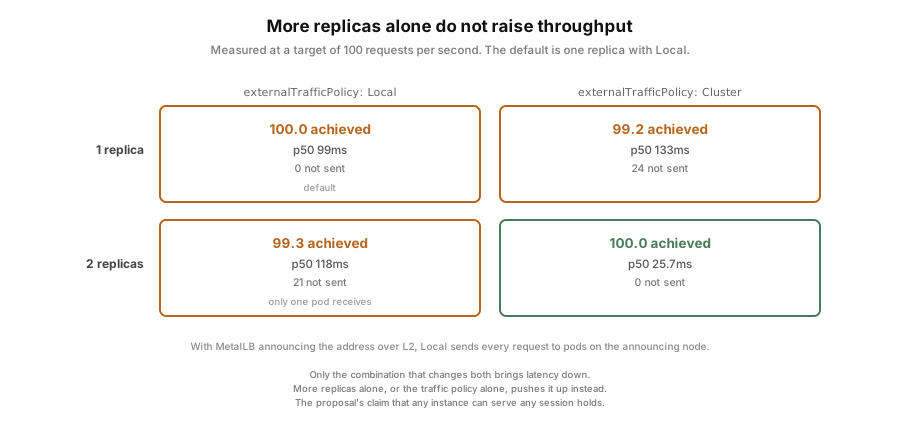
The service the gateway creates defaults to externalTrafficPolicy: Local, and where
MetalLB announces the address over L2, requests arriving at the announcing node go only
to pods on that node. So raising replicas to two leaves one pod taking every request.
Counting requests per pod showed one of them at zero.
I measured all four combinations back to back in one run, opening a new connection per request.
| Condition (target 100 per second) | Achieved | p50 | Not sent |
|---|---|---|---|
1 replica, Local (default) | 100.0 | 99.0ms | 0 |
1 replica, Cluster | 99.2 | 132.6ms | 24 |
2 replicas, Local | 99.3 | 118.2ms | 21 |
2 replicas, Cluster | 100.0 | 25.7ms | 0 |
More replicas alone push latency from 99.0ms up to 118.2ms, and the traffic policy alone pushes it to 132.6ms. Changing both brings it back to 25.7ms, its unloaded level. The design proposal says session information is encrypted into the session identifier so any instance can serve a session, and since requests really did divide between two pods without a single error, that description appears to hold.
Trace headers do not reach the backend
I checked the observability side as well, with a server built to reflect back the
headers and the JSON-RPC _meta field it receives, to see what the backend gets.
| What the client sent | Direct call | Through the gateway |
|---|---|---|
HTTP header traceparent | received | not received |
params._meta.traceparent | received | received |
| nothing | none | none |
_meta getting through is the JSON body being passed along, not the gateway putting
anything in. The evidence is that when nothing is sent the backend has nothing either.
agentgateway, at the same point, carried the same trace-id through with its own span-id
and put it into _meta as well, so the two gateways differ here.
This was measured with tracing off, though. Agent Router has a separate path for turning tracing on through OTel environment variables, which I did not use this time. Even so, tracing being off does not look like a reason to drop a header the client sent, so if end-to-end tracing matters to you it is worth another look with it enabled.
One more thing. The protocolVersion in the initialize response comes back fixed at
2025-06-18 no matter what the client asks for. Sending a date that does not exist
returns the same value. If you plan to attach a client that speaks only an older spec,
check this first.
So when is it a good fit?
When argument-level control is genuinely needed and the load is tens of requests per second, it fits. If blocking by tool name is enough, or latency is tight, 20ms per response is not a small cost. If throughput is the problem there is a way out in replicas, but it is worth remembering that the traffic policy has to change with them.
Things to check if you adopt it
- Wrap argument-condition CEL in
!has(request.mcp.params.arguments) ||, and printtools/listonce after applying the policy to confirm tools are still there. - Write the backend-side original tool name in
target.tools[].tool. The renamed name the client sees blocks every call, and there is no setting that stops the backend name from being prefixed. *cannot be used intarget.tools[].backend, so spell the backend name out.- If you use
backendSelector, do not leave its rules empty. Doing so returns 403 frominitializeand closes the whole endpoint. - Denials arrive as plain HTTP 403, so check the error handling of the agent SDK you use.
- The
traceparenta client sends does not reach the backend, so if end-to-end tracing matters, check the path with tracing enabled separately. protocolVersioncomes back as a fixed value, so check before attaching a client on an older spec.- When raising throughput, look at
externalTrafficPolicybefore replicas. - Envoy Gateway needs the extension-manager configuration applied separately. A default install alone will not run Agent Router.
Limits
The path with tracing enabled was not measured. I compared only two iteration counts, 100,000 and 1,000, so how latency and throughput move between them is unmeasured. Both backends have few tools (8 and 2), so what filtering a list costs on a server with hundreds of tools is something I did not confirm. Replicas were measured only up to two, and authorization with OAuth was left out of scope. One cluster, one host, arm64, so absolute figures can differ by environment; what this measurement speaks to is the relative comparison between paths. And this is not a direct comparison with agentgateway. The deployment shapes of the two differ, so the conditions have to be settled first, and I left that to a later stage.
Closing
What I set out to check was whether the argument-condition authorization the
documentation describes actually works, and the answer is that it does. Turning that
feature on the way the documentation shows brings along a behavior where an agent can
no longer find any tools, and wrapping the CEL expression in has() avoids it. Passing
through costs close to 20ms per response and the default deployment tops out around 100
requests per second. That is not the policy but the key derivation the proxy repeats to
unwrap the session ID, and lowering one helm value took the response to 1.55ms and
throughput to 805 requests per second.
The manifests, harnesses, condition definitions and raw data are in the GitHub repository. The other MCP gateway under the same foundation, measured earlier with the same frame, is in agentgateway-study. If you reproduce this in a different environment, I would be glad to hear what you find.