Once MCP (Model Context Protocol) servers start to multiply, a gateway in front of them is the natural next thing to consider. I picked agentgateway, a hosted project of the Agentic AI Foundation (AAIF), and since a feature table cannot answer “does turning a policy on actually block the call”, I decided to measure it. The yardstick is the one I used when comparing seven Kubernetes Gateway API implementations: what is declared and what is enforced are two different things. In this post “the gateway” with no further qualifier means agentgateway, which is not the same thing as a Kubernetes Gateway API resource, so please keep the two apart while reading.
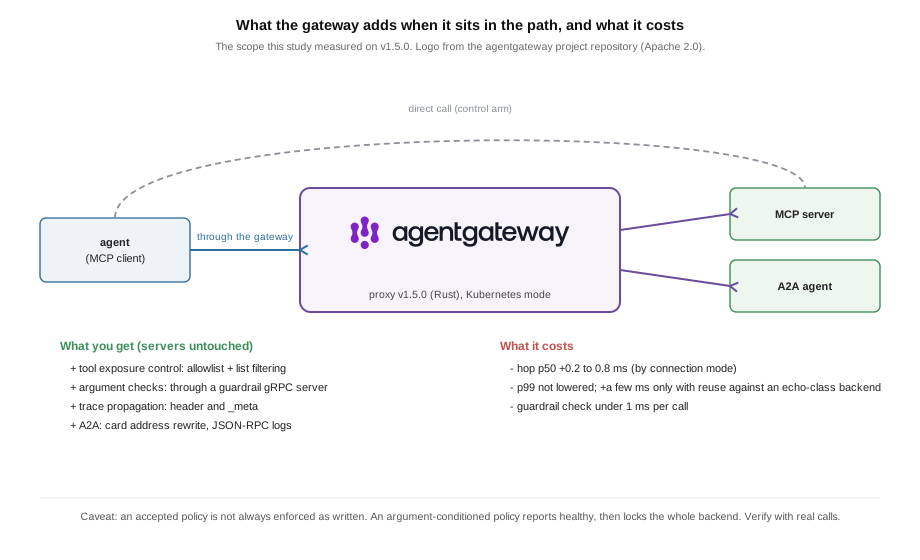
It is worth settling what agentgateway is before going on. It is an open-source proxy that takes, in one place, the traffic of agents calling tools over MCP, agents calling other agents over A2A (Agent2Agent), and applications calling LLM providers. Solo.io created it in March 2025, contributed it to the Linux Foundation in August of the same year, and it became a hosted project of the AAIF in June 2026. The reason the project gives for its own existence is that infrastructure built for web traffic lacks the control and observation that agent traffic needs, and that a gateway can add both without touching the server. In Kubernetes mode a built-in control plane reads Gateway API resources and its own CRDs (Custom Resource Definitions) to configure a data plane written in Rust, and for MCP it parses the JSON-RPC and evaluates CEL authorization rules per tool. With a declared feature list this long, I wanted to know how far that list sits from what happens on an actual call. Here is what the gateway adds to the path and what it charges for it.
- Policy: a control rule attached to the gateway. In agentgateway it lives in a
Kubernetes resource called
AgentgatewayPolicy, and the rules are written in CEL (Common Expression Language, Google’s expression language for conditions). - Tool-name allowlist: a policy that lists the tool names to allow and blocks every other tool call. This is the most basic form of control.
- Argument-conditioned policy: a policy that looks past the tool name at the argument values passed to the tool, such as “allow get-sum only when a is 1”.
- tools/list and tools/call: the two basic MCP requests. tools/list fetches the list of tools the server has, and tools/call invokes one of them. Gateway policies apply to both.
The short version first. The cost of going through the gateway was small, under 1 ms at p50 (the median) per tool call (1 to 3 ms for a tool list), the tail latency (p99) never improved, and in return I got control and observation that a server cannot do per client on its own. One argument-conditioned policy, however, was reported as accepted and still did not enforce what it said, which is why I concluded that turning a policy on is not the end of the job: send real calls and check.
The setup is a three-node VirtualBox Kubernetes v1.37.0 cluster with agentgateway v1.5.0, and the backend is the new-spec (2026-07-28) server from the MCP stateless migration, unchanged. I actually measured this twice. The first round was on v1.4.1 and went public in August; when v1.5.0 came out I re-measured everything on a fresh cluster. Every deterministic result, the policies and the observation, came out the same, and only the latency numbers were replaced with new values. Along the way one reading from the v1.4.1 round had to be withdrawn, and that story is in the cost section. These are virtual-machine numbers, so please read them as relative comparisons between conditions rather than absolute values. Everything below can be reproduced with the harness in the GitHub repository.
What a tool-name allowlist blocks, and what it hides
Let me start with the most basic control, the tool-name allowlist, a policy that lists the tool names to allow. With a policy that allows only the echo tool, calls to any other tool are rejected with a 400, and the blocked tools disappear from the tools/list result as well, leaving only echo. One policy handles both the rejection of the call and the removal from the list.
The shape of the rejection is actually the more interesting part. It does not come back as an authorization error but as “Unknown tool” (-32602), and in the JSON-RPC standard that MCP follows this code means “invalid params”. This is a deliberate design: the gateway does not reveal that permission was denied, and makes the blocked tool look as if it never existed (to prevent tool enumeration, as discussed upstream in #758). The trade is that a client cannot tell a permission problem from a missing tool. I will come back to what this choice means from an agent’s point of view.
So what does the list filtering cost? With 8, 100 and 500 tools registered on the server, I compared tools/list through a policy that keeps one tool against tools/list with no policy, and the p50 difference stayed within 0.7 ms, so the cost of filtering at the gateway is effectively zero. It did not save any time either. The response the client receives shrinks from 181 KB to 467 bytes at 500 tools, but the time taken was the same as for the unfiltered list, because the gateway fetches the server’s full list first and filters afterwards. A slow tools/list on a server with many tools therefore stays just as slow behind the gateway, and that time has to be cut on the server side.
Why an argument-conditioned policy is accepted and then blocks every call
The finding I considered most important in this round is that a policy conditioned not on the tool name but on the argument values passed to the tool, an argument-conditioned policy, behaved differently from what I expected. It looks as though a condition like “allow get-sum only when a is 1” can be written in CEL, but attaching it produces a completely different result.
mcpAuthorization:
  rules:
    - 'mcp.tool.name == "get-sum" && mcp.tool.arguments.a == 1'
This policy passes control-plane validation (Accepted) and reports a healthy status. Yet the call that meets the condition (a=1), the call that does not (a=2), and a tool the rule never mentions (echo) are all blocked, and tools/list returns an empty list. The CEL context at authorization time has no tool arguments, so the condition can never be true, and since the rule list has allowlist semantics, nothing ends up allowed.
What if you add a guard of the form !has(mcp.tool.arguments) || condition
so that calls without arguments pass? The blocking goes away. But because the
tool arguments are simply absent when authorization is evaluated, has(...)
is false for every call, its negation is always true, and the argument
condition on the other side of the OR is never even evaluated: the whole rule
is true. In effect the rule is evaluated on the tool name alone, and the a=2
call it was meant to block passes as well (I confirmed this by measurement).
There is therefore no way to make argument control work with this
authorization policy form, and an operator who believes argument control is in
place actually has either every call rejected or the condition gone. I checked
the policy status, the client responses, the proxy log and the control-plane
log, and none of them recorded anything about this. It deserves particular
care in operation.
Looking into the background, the fact that agentgateway’s authorization context carries identity only is itself intended. The policy applies to tools/list and tools/call alike, and at list time there can be no arguments; a maintainer has filed the discussion, with a proposed improvement, upstream as #2069. The architecture document states this limitation, but the schema documentation that users actually read makes no distinction between stages, so I reported the gap as #3092, and a community PR (Pull Request), #3127, that adds a warning to that documentation is under review. The maintainers’ view, though, is that writing the limitation into the documentation is the right fix rather than a warning tailored to one issue, so a resolution in the form of a warning looks unlikely. I reproduced the behavior first measured on v1.4.1 unchanged on the v1.5.0 release and left the result as a comment on the same issue.
One more related change landed as I was writing this. PR #3301, merged to main on 2026-09-03, makes the gateway parse the MCP body before route-level policies run, and it is not in a release yet. So I swapped only the proxy for a dev image and attached the same condition as a route authorization policy (traffic.authorization): a=2 was rejected with a 403, and a=1 and echo passed. The mcpAuthorization form discussed in this post still blocked every call on the dev image, and on v1.5.0 the route form was accepted and had no effect. If you plan to write argument conditions as route policies, check first that your release includes #3301.
How argument-level control actually works: guardrails
Does that mean giving up on argument control? No. There is an external gRPC
processor mechanism called guardrails (the configuration field is
mcpGuardrails), and with a policy server of about 70 lines of Python that
enforces “allow only when a is 1”, a=1 passed, a=2 was rejected, and unrelated
tools were unaffected. agentgateway ships the tool arguments in the gRPC
request as they are, so the checking server can inspect the original.
The rejection takes a different shape from authorization, too. Where an authorization rejection is a 400 with “Unknown tool”, indistinguishable from a missing tool, a guardrail rejection is HTTP 200 plus a JSON-RPC error (-32001) carrying the reason string the server chose (“get-sum is allowed only with a == 1”) verbatim. When the checking server goes away, the default FailClosed blocks every tools/call, and switching to FailOpen lets them through, both as documented.
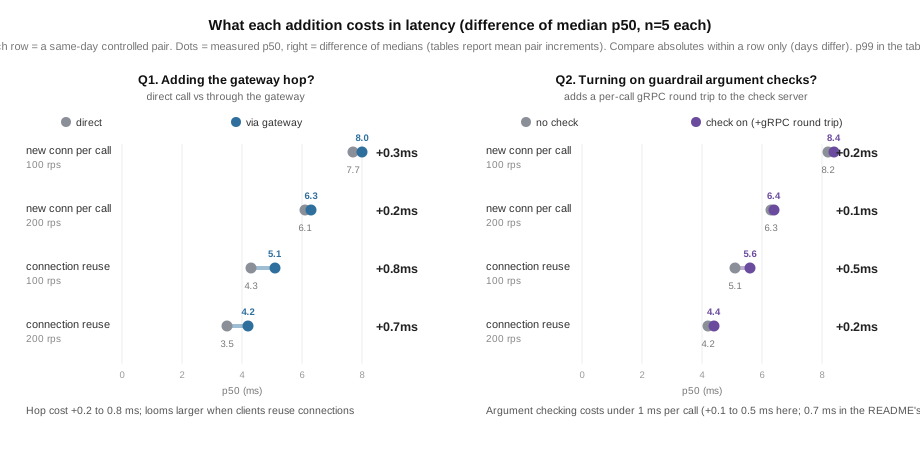
I also measured the extra latency of this mechanism. With the gateway and the guardrail pod installed under both conditions and only the policy toggled, alternating the two conditions back to back within each round, the argument check cost +0.1 to 0.7 ms at p50 per call and never exceeded 1 ms at any load or connection mode I measured, and under 30 minutes of continuous load it held at +0.5 ms. In the v1.4.1 round I had read this increment as constant regardless of load, but in the new environment it spread from 0.1 ms at 200 requests per second (rps) to 0.7 ms in the 400 rps range where the load generator saturates, so I dropped the word “constant” and kept only the upper bound, “under 1 ms per call”.
One more thing worth separating here. The v1.5.0 release notes list “guardrails for tool calls” as a new feature, and that is a different mechanism from the guardrails described above. It is the LLM prompt guard, which inspects tool_calls inside LLM traffic, and attaching it to an MCP backend gets the policy accepted while having no effect at all on tools/call (checked 2026-09-09). It is the same split between an accepted policy and actual enforcement that the argument-conditioned rule showed.
The latency cost of the gateway hop, and what happens to p99
The cost of the gateway itself is of course the other question, and controlling the conditions mattered most here. With the gateway control plane and proxy installed, I measured both the direct path and the gateway path so that the resource conditions were identical, narrowed the difference between the two paths to the target address in the load generator, and alternated them within each round.
With a new connection per call, p50 rose by +0.2 to 0.3 ms, and with connection reuse it took +0.7 to 0.8 ms more. Given that the real work of a tool call runs from tens of milliseconds to seconds, this is a size a user would not notice in conversation under either condition. The p99 side, however, came out differently from v1.4.1. On v1.4.1 the p99 in the new-connection condition was actually lower through the gateway, and I had read that as “the gateway handles connection churn in its own layer and lowers p99”. On v1.5.0 and the new cluster, p99 in the new-connection condition was equal to or slightly above the direct path, and in the reuse condition it was 3 to 7 ms higher. The version and the cluster changed together, so I cannot say which one is responsible, but it is clear that the reading does not hold in the new environment, so I withdrew it.
So under which conditions does the gateway’s p99 penalty appear? To answer that, I added artificial processing time on the server side (0, 10, 50 and 200 ms) and repeated the same comparison. Here is the picture.
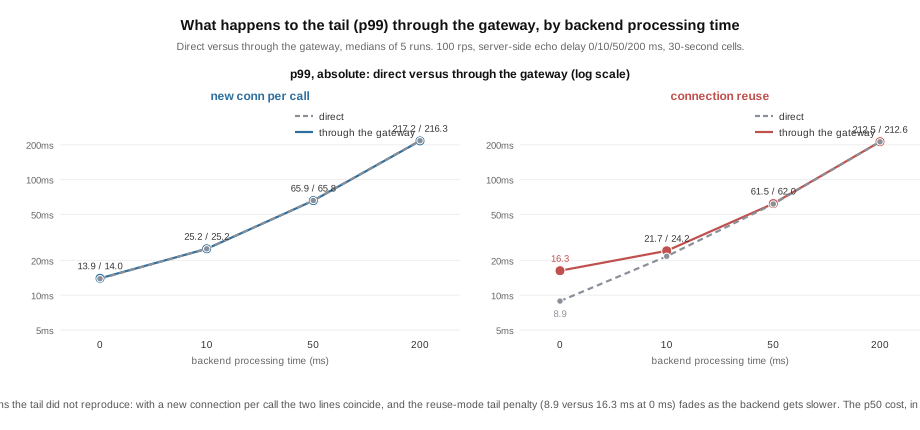
With a new connection per call the two lines overlap across the whole range, which shows that the gateway does not change p99. With connection reuse, the gap is 8.9 ms against 16.3 ms when the backend has no processing time, narrows to 61.5 ms against 62.0 ms when the backend spends 50 ms, and disappears at 200 ms. In other words, what the gateway hop adds to p99 is a fixed amount of a few milliseconds, which becomes invisible the moment the backend actually spends time. The shape was the same in a 30-minute continuous-load run, and putting a slow backend (200 ms) behind the same gateway and loading it did not worsen the fast backend’s p99. One caveat: when opening 200 new connections per second for 30 minutes, the load generator began to drop requests, but the same experiment without the gateway, calling the server directly, dropped them in the same way, so that limit is the connection-setup ceiling of the measurement environment, not the gateway’s.
To sum up, a gateway is not something you add for performance. You pay the cost of one extra hop (under 1 ms at p50 per tool call, 1 to 3 ms for a list, a few milliseconds of p99 under specific conditions) and get control and observation in return. Here is what each control adds and what it costs, pair by pair.
Rejections differ by layer, and the agent loop reads them
I mentioned that the shape of a rejection differs by layer. Here it is on one page.
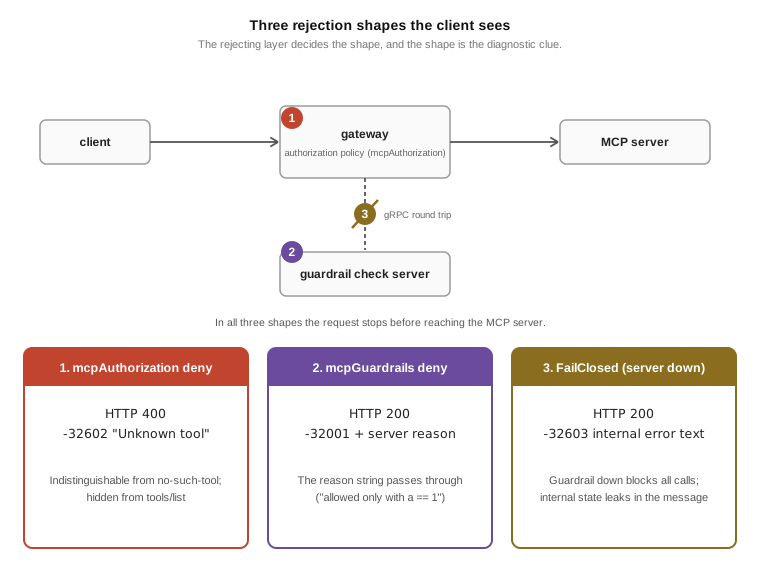
The same “rejection” comes back from an authorization policy as a 400 with “Unknown tool”, indistinguishable from a missing tool; from a guardrail as a 200 carrying the reason the server chose; and from a checking-server failure (FailClosed) as a 200 with an internal error message. Monitoring that looks only at HTTP status codes counts the latter two as successes, so the JSON-RPC error has to be inspected as well; conversely, for an operator the shape of the response is a diagnostic clue to which layer did the blocking.
There is one more thing worth thinking about. The reader of these responses is mostly not a person but an agent loop. The LLM reads the rejection text as a tool-call result and decides its next action, so an agent that receives “no such tool” may try another way around, while an agent that receives a reason with the condition spelled out has grounds to fix the argument and retry. The guardrail’s rejection reason therefore effectively acts as input the LLM reads, that is, as a prompt. I did not measure agent behavior itself, so this paragraph is interpretation, but keeping in mind that an agent will read the rejection message when you write one costs nothing.
Trace-context propagation that the documentation does not mention
On the observation side I found something that works better than expected.
When the client sends a traceparent header, the downstream server received a
traceparent header with the trace-id unchanged and only the span-id replaced by
the gateway’s, and the same value was injected into the slot that the MCP spec
reserves in _meta (5 out of 5 runs). I could not find this behavior in the
agentgateway documentation, so this time there was more happening than the
documentation says. It means the tracing context continues from the agent to
the tool without touching the server code, which is welcome from an operations
point of view. Note that this measurement checked the header and _meta the
downstream receives with the gateway’s tracing configuration turned off. With
tracing turned on, a problem with span parenting was reported upstream as
#2904 and fixed after v1.4.1, and I did not measure that condition this time.
On the A2A side: address rewriting and observation, no enforcement
Since the same gateway also takes A2A traffic, I checked what it does for A2A
the same way. In short, agentgateway does two things for A2A: it rewrites the
address in the agent card to its own, and it records the JSON-RPC error code in
the access log. There is no authorization policy in v1.5.0 that restricts who
may call which agent. The card rewrite is opt-in, enabled by putting
appProtocol: agentgateway.dev/a2a on the Service, and on a card that carries
both the v0.3-style url and the v1.0-style supportedInterfaces, only the
supportedInterfaces side is rewritten to the gateway address, so a client
that reads the old format receives the backend’s direct address and bypasses
the gateway entirely. I confirmed with an actual SDK server that this
mixed-format card is what the official Python SDK emits by default, so if you
run A2A agents behind the gateway, fetch the card through the gateway once and
read the addresses it actually carries. The details are recorded in the
repository’s
A2A section.
A checklist for after you turn a policy on
Let me turn the above into an operating procedure.
- After turning a policy on, send the calls that should pass and the calls that should be blocked, and check. For policies with argument conditions in particular, check without exception that the matching call passes. An “accepted” status did not mean “enforced”.
- Look at the tools/list result as well. List filtering moves with the policy, so an empty list means the policy is matching nothing.
- If prefixMode adds a prefix to tool names in your environment, write the policy with the original name from before the prefix. Writing it with the prefixed name the client sees in tools/list gives the same total blocking as the argument-conditioned policy.
- If you need argument-level control, build a checking server with guardrails. The latency cost is under 1 ms per call, so it is not a heavy burden, and write the rejection reason as a sentence an agent can read and correct itself with. From the release that includes PR #3301, the same condition can also be attached as a route authorization policy, so check the release notes.
- Do not expect the gateway to improve p99. The hop costs under 1 ms at p50 per tool call, p99 does not improve, and a p99 penalty of a few milliseconds shows only when a connection-reusing client calls a very fast tool.
- On a server with many tools, the gateway does not shorten tools/list, so manage the list size on the server side.
- FailClosed is the default, so when the checking server stops, tools/call stops with it. Plan redundancy for the checking server as well.
The harness, the guardrail policy server and the scripts that draw the figures are all published in the repository. If you reproduce this on another gateway or in another environment, I would be glad to hear the result.