They can write code, but can they operate?
There is no shortage of benchmarks for the coding ability of CLI agents such as Claude Code, Gemini CLI, and Codex CLI. SWE-bench, HumanEval, LiveCodeBench, and others all measure that side of the work. What you actually do in operations, though, is usually not coding. It is incident diagnosis: standing in front of a dead CrashLoopBackOff pod, reading the logs, deciding whether an OOMKill is a memory shortage or a misconfigured limit, and sometimes being honest enough to say “this problem is outside the cluster.”
This benchmark was built to answer that question. Nine combinations of three agents and three model tiers were run against the same Kubernetes cluster, the same prompts, and a cold start, across ten incident scenarios. The numbers and how to reproduce them live in the GitHub repository. This post walks through what decisions went into the scoring and why, and which findings turned out to be the most interesting.
The results at a glance
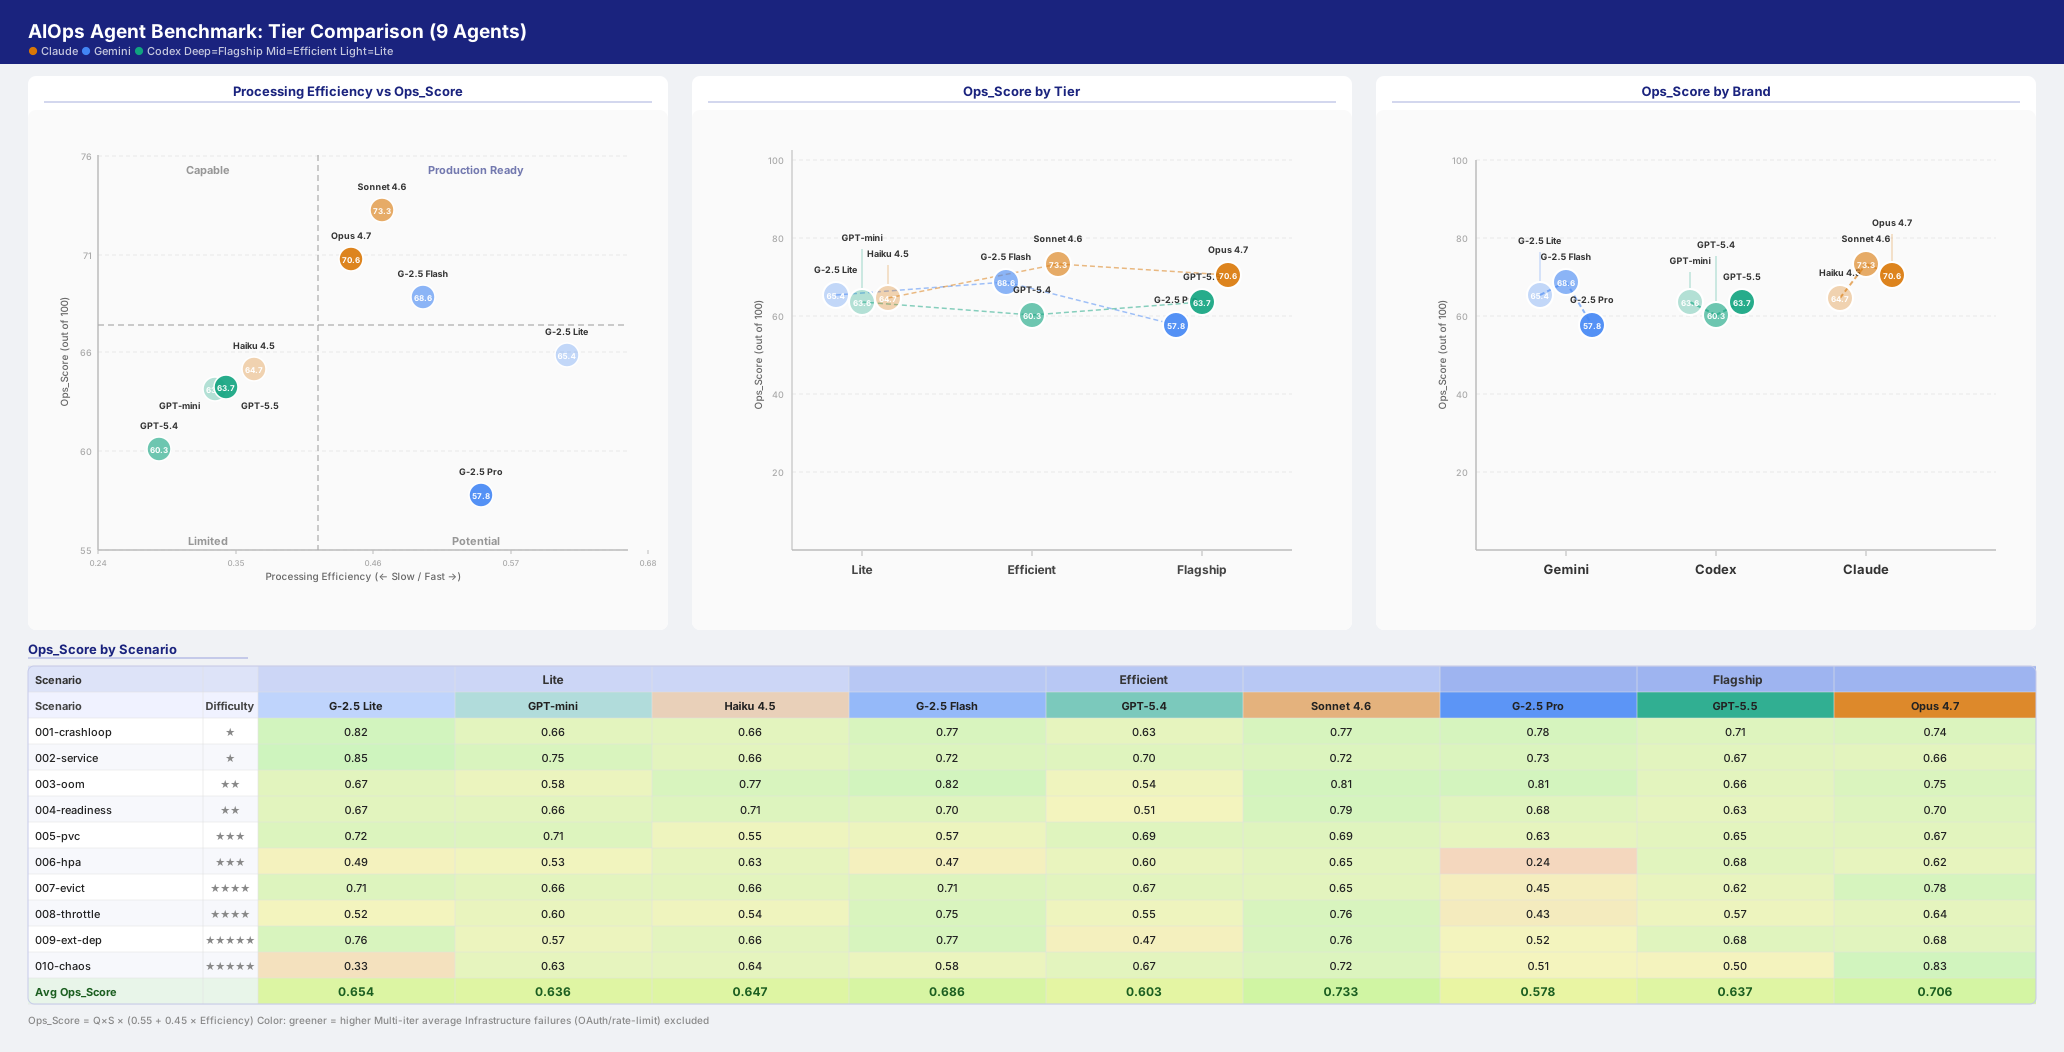
Reading the chart, three things stand out.
- Sonnet 4.6 in the Efficient tier (Ops 0.733) is the top of all nine agents, ahead of every Flagship model.
- Each brand has a distinct personality. Claude leads on quality and safety, Gemini on efficiency, and Codex sits in the middle of both.
- In the Lite tier the winner is Gemini Flash-Lite, not Haiku (0.661 vs. 0.647). The gap is small, but its meaning is not.
The full table and all numbers are in the README results section. From here we move into why the results came out this way.
Two scoring decisions that shape everything
A benchmark is often defined more by what it leaves out of the score than by what it measures. Two decisions made in this one strongly shape how the results should be read.
Efficiency only moves the score by ±45%
The Ops_Score formula is Quality × Safety × (0.55 + 0.45 × Efficiency). Even with an efficiency of zero, an agent keeps 55% of its quality and safety score; with a perfect efficiency, it gets 145%.
The reasoning is simple. In operations, a slow correct answer is far more valuable than a fast wrong one. An agent that takes one minute to declare “I restarted it” when in fact the database is down is much worse than one that takes five minutes and reports “this looks like a DNS issue, the infra team needs to check.” But dropping efficiency entirely would just reward agents that burn tokens forever. ±45% is the middle ground.
This is exactly why Sonnet ended up at the top of the nine. Its quality and safety score (0.968) is essentially tied with Opus (0.949), and its efficiency was comparable too. The fact that it did the same work with fewer tokens then carried it past Opus on the composite.
Dollar cost is excluded from the score and the charts
Gemini 2.5 Flash is priced at roughly 10x cheaper input tokens and 6x cheaper output tokens compared to Claude Sonnet for equivalent workloads. If those prices were rolled into the score, Gemini would land in a structurally favorable position on every chart. But that gap reflects pricing policy by the provider, not operational quality.
So the score and charts work purely on token volume, with dollar cost retained only as a reference column. Prices change frequently; “who diagnosed the problem better given the same tokens” stays much closer to the actual model capability.
Interesting findings
The kinds of behaviors that rarely appear in general coding benchmarks but do show up under operational tasks.
A Flagship is not always the better choice
The most expensive and most capable model in the lineup made the silliest mistake. One top-tier model read the structured prompt (Context / Task / Rules format) as a “benchmark definition document” rather than an actual work instruction. It exited after 28 seconds without running a single kubectl command, with an accuracy score of zero.
The same prompt was handled correctly by a lower-tier model. The more capable a model gets, the stronger its sense of “I am being evaluated right now.” When that self-awareness crosses a certain line, the reasoning starts to question the task itself rather than execute it. In operations automation, that is a critical kind of failure.
Hidden dependencies inside the CLI can change the result
For one of the agents, the web search tool internally called an auxiliary model. When that auxiliary model became unreachable, the whole session aborted. The output file came back at zero bytes, and from the outside it just looked like “the agent failed.” The actual cause was a dependency hidden inside the CLI implementation.
When we put an agent in front of operations, we typically ask “how good is the model?” But the CLI wrapper brings its own tools, its own internal models, and its own retry logic, and those decide a meaningful slice of the outcome. Vendor selection cannot stop at the model.
Opus vs. Sonnet: paying more does not always pay off
Opus 4.7 (0.706) and Sonnet 4.6 (0.733) are statistically near-tied on the composite. Look closer by scenario, though, and a pattern shows up.
- On easy scenarios (★, ★★), Sonnet delivers the same quality with fewer tokens and less time.
- On hard scenarios (★★★★ and above), Opus pulls ahead on completion rate, tracking complex signals more persistently.
In other words, day-to-day operations work is well served by Sonnet, and the Flagship’s premium really only shows up in complex multi-failure analysis. Running everything through Opus is not a cost-effective choice.
Which agent should you pick for which situation?
| Situation | Recommendation | Why |
|---|---|---|
| Operational safety and diagnostic quality come first | Claude (Sonnet or Opus) | Highest quality × safety, fewest unsafe actions |
| Balanced day-to-day operations | Sonnet 4.6 | Highest Ops_Score of all nine, 100% pass rate |
| Speed and cost are higher priorities | Gemini Flash | Top efficiency, several-times cheaper per equivalent token |
| Lightweight automation or script assistance | Gemini Flash-Lite, Haiku | The Lite tier is already usable in quality |
| Complex multi-failure analysis | Opus 4.7 | Best completion rate on the hardest scenarios |
One thing to keep in mind if you are evaluating this for adoption: re-validate in your own environment. These results are a snapshot of the models and CLI versions as of May 2026, and the scenarios were constructed in a synthetic setup. Real production traffic and real monitoring tooling will give you a different picture.
Closing thoughts
The real value of a benchmark is not the leaderboard itself, but the personality of each model that the leaderboard process reveals. Running these nine agents under identical conditions made it clearer that the right question is not “which one is best” but “which one is right for which situation.” And the most practical takeaway turned out to be: a higher tier is not always better.
Full scenario definitions, cluster bootstrap scripts, and scoring code are in the GitHub repository.