The component nobody looks at after install
When did you last look at your CNI? Most of us pick one when the cluster is built and only think about it again when an upgrade notice arrives. I was the same. Meanwhile the CNI’s agents and controllers keep using CPU and memory on every node, all the time.
So how much do they use? Looking for an answer turned up something interesting: throughput benchmarks are everywhere, but I could not find a public source comparing standing resource usage under identical conditions. Vendor docs do not have it either. Cilium ships its helm chart without resource requests, and a Calico maintainer declined a request to publish recommended values. Search results for these numbers are often filled by sources with no traceable origin.
This gap matters because of where the market is heading. Training and certification treat Calico as the de facto standard, while managed-service defaults and large migration stories keep pointing at Cilium. The last question a team asks before migrating is exactly “so how much more does it use day to day?”, and the migration case studies stay quiet on that point. If nobody has the answer, the only option is to measure it.
So we measured it: Calico Open Source, Cilium, Flannel, Antrea, and kube-router, split into 14 configurations, running unattended for 9 days, for 73 valid measurement runs. All numbers and the reproduction harness are in the GitHub repository.
What we measured, and how
The target is standing cost: the CPU and memory the networking stack (every CNI component plus kube-proxy) uses at rest and under load. We did not measure throughput or latency. On a virtualized 3-node cluster (VirtualBox), the virtual switch would blend into those numbers and they could not be attributed to the CNI itself. Load is used only as a stimulus that triggers resource consumption.
The 14 configurations isolate one meaningful switch at a time. Calico gets four (install method operator/manifest, dataplane iptables/eBPF, BGP on/off), Cilium gets a four-step chain (defaults, then Hubble off, then kube-proxy replacement, then netkit), Flannel two (kube-proxy iptables vs nftables), Antrea two (FlowExporter on/off), kube-router two (all-features vs CNI only).
Each run walks 6 phases: idle, a ramp to 60 pods, 100 NetworkPolicies, 200 Services, churn (deleting 10 pods every 20 seconds so they keep getting recreated), and a node drain/rejoin. Every configuration switch restores a CNI-less base snapshot so nothing survives from the previous one.
Collection followed three rules: install nothing into the cluster under test (kubelet cadvisor metrics polled through the API-server proxy), report memory as working set with RSS alongside, and measure eBPF map kernel memory separately with bpftool. That third rule turns out to matter; more on it below.
The map: lower-left is the quiet corner
Plotting the 14 configurations by idle memory (x) and churn-phase CPU (y) gives this picture.
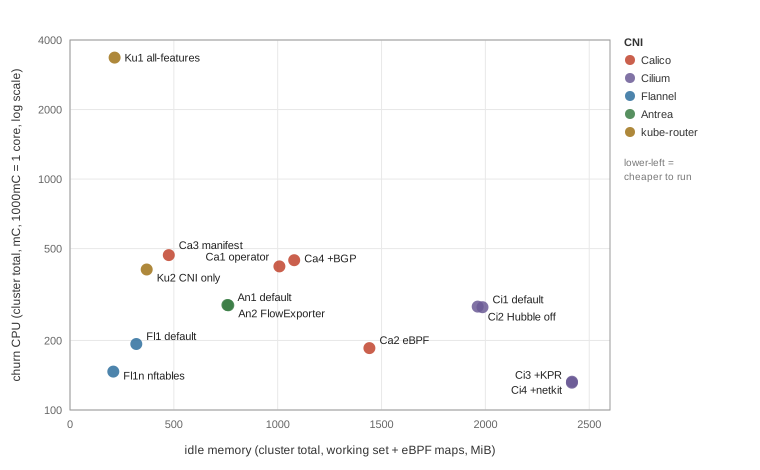
Three things jump out. First, the horizontal spread is wide: the lightest configuration (Flannel + nftables, 209MiB) and the heaviest (Cilium KPR with maps, around 2,400MiB) are more than 10x apart. Second, only one point sits in the top-left: kube-router in all-features mode. Third, everything else clusters between 150 and 470mC of churn CPU, which is another way of saying the real axis of standing cost is memory, not CPU.
Finding 1: memory usage is what separates the conditions
Idle CPU topped out at 127mC (0.13 cores, cluster total) even in the heaviest configuration, so day-to-day CPU is unlikely to be a problem whichever CNI you pick. Memory usage is different. On small 4GB nodes, whether the networking stack occupies 100MiB or 800MiB changes what is left for workloads. If you choose a CNI on resource grounds, memory is the axis to look at.
There is a trap here. The eBPF map kernel memory that eBPF-based CNIs use
lives outside process metrics and never shows up in kubectl top. Measured
node totals: Cilium default 412MiB, Cilium KPR 712MiB, Calico eBPF 521MiB.
Calico eBPF actually has a smaller process footprint than its iptables
sibling (920 vs 1005MiB), so leaving maps out can flip the comparison. Memory
comparisons of eBPF CNIs need bpftool accounting included.
Finding 2: switching kube-proxy to nftables mode cut memory by 70%
To me this is the most actionable result of the whole campaign. nftables mode is the successor Kubernetes built to fix iptables mode’s performance problems; it went GA in 1.33 but iptables is still the default in 1.36 for compatibility. The official post NFTables mode for kube-proxy shows the latency improvement in numbers, but does not cover the kube-proxy process’s own resource usage.
Comparing two configurations that differ only in kube-proxy mode, on the same Flannel:
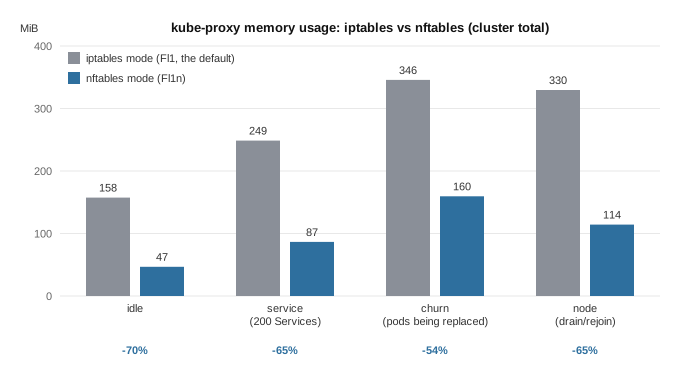
Idle working set dropped from 157.5MiB to 46.8MiB (-70%), and the direction held with 200 Services in place (-65%) and during churn (-54%). It was the largest saving in this measurement that did not involve changing the CNI. If you run kube-proxy, the nftables switch is worth evaluating.
Finding 3: kube-router all-features mode does not come back down after churn
kube-router is the integrated option: pod networking, NetworkPolicy, and an IPVS service proxy in one daemon. Its all-features mode was the lightest of all configurations at idle (2mC / 215MiB). But once churn started, it climbed to 3,355mC cluster total (about 1.1 cores per node) and stayed there after churn ended. All five repetitions produced the same numbers.
We reproduced it once to narrow the cause. No pod restarts, no OOM kills, no error logs; the CPU went to a userspace loop inside kube-router. The most telling observation is history dependence: the same object scale (200 Services, 12,008 endpoints) cost 77mC before churn, holds at 3,300mC after one churn episode, and returns to idle within 90 seconds of deleting the load objects. The split configuration that leaves Services to kube-proxy was normal under the same load, so the cause most likely lies in the IPVS service proxy; we did not identify which internal operation is responsible. If you are considering all-features mode on a cluster with frequent pod replacement, this behavior is worth knowing about.
Finding 4: for Calico, the install method changes memory more than the dataplane
On the same iptables dataplane, the operator install uses 533MiB more idle memory than the manifest install, because two Typha replicas, two calico-apiservers, csi-node-driver, and tigera-operator all stay resident. By contrast, switching the dataplane to eBPF moves process memory by only 85MiB. The mundane question “how do you install it” weighs more on resident memory than the flashy question “which dataplane do you run”. The operator does buy management convenience; 533MiB is the price of that convenience.
Finding 5: leaving observability features on costs very little
Cilium’s Hubble (helm default, no relay or ui) off vs on: about 22MiB of agent memory, CPU inside repetition variance. Antrea’s FlowExporter trended the same at +5~10MiB. The real cost of an observability stack appears to come from the extra components (relay, ui, collectors), not the feature toggle itself. At the default-configuration level, resources are not a reason to turn these off.
Before you reuse these numbers
Three cautions. First, as above, eBPF maps never appear in kubectl top.
Second, working set and RSS differ by up to 5x per component (cilium-agent:
1,137 vs 236MiB); check which metric a source uses before comparing. Third,
absolute CPU shifted 20~33% between measurement windows depending on host
conditions. The 14 configurations rotated within each repetition round, so
condition-to-condition comparisons are unaffected, but read the absolute CPU
numbers for ranking and rough scale.
The limits are equally clear: this is a small 3-node virtualized setup, so do not extrapolate absolute values to large clusters; throughput and latency are out of scope; encryption and observability extras are too.
Closing
The opening question was “how much does a CNI use day to day?” The answer:
CPU is negligible whichever you pick, and memory usage spans an 8x range
depending on configuration. Counting that memory honestly means including the
eBPF maps that kubectl top never shows, and you can cut 70% of kube-proxy’s
share without changing your CNI at all, just by switching its mode.
The full 14-configuration tables, per-component numbers, and the reproduction harness are in the GitHub repository. If you reproduce this in a different environment, I would be very glad to hear what you find.